 Escape
From the Lost Laboratories (pdf link) is my entry into the One
Page Dungeon Contest 2011. It is, perhaps, a bit more free form in
its room descriptions than some one-page dungeons. Since the rules
specify that the dungeon needs to be system agnostic, I tried to give
just enough detail that readers would think “Ooo… I bet this is how
you’d represent that in [insert game of choice]”, but not so much that
two different people would do it the same way.
Escape
From the Lost Laboratories (pdf link) is my entry into the One
Page Dungeon Contest 2011. It is, perhaps, a bit more free form in
its room descriptions than some one-page dungeons. Since the rules
specify that the dungeon needs to be system agnostic, I tried to give
just enough detail that readers would think “Ooo… I bet this is how
you’d represent that in [insert game of choice]”, but not so much that
two different people would do it the same way.
When reading through it, it should be pretty obvious that the experience your players have will be highly dependent on their access to teleportation magic. The title assumes they don’t have any, so that their only choice at escape is to work through the dungeon. If, however, they can teleport on their own, the focus of the whole adventure changes pretty drastically, shifting to more about exploration and investigation of what the place is and how the players might use it for themselves. Some parties might get sucked into the network, take a quick peek, teleport out, and never think about the place again. Others might do serious exploring and be more interested in finding out about its builders, and so on. (If tamed, it would make a pretty great “home base”, for example.)
I am open to feedback on this dungeon, so post it if you have any. Though I have already submitted this entry, the contest allows resubmission with updated versions, so I have until the end of March. Also, feel free to post how you’d flesh out the rooms for a specific system. If anyone is really clamoring for it, maybe I’ll build a Pathfinder version once the contest is over, with MapTool maps and such.
At a more “meta” level, this dungeon makes explicit the notion that all dungeon maps are really just directed graphs. The graph is plain to see in my entry:

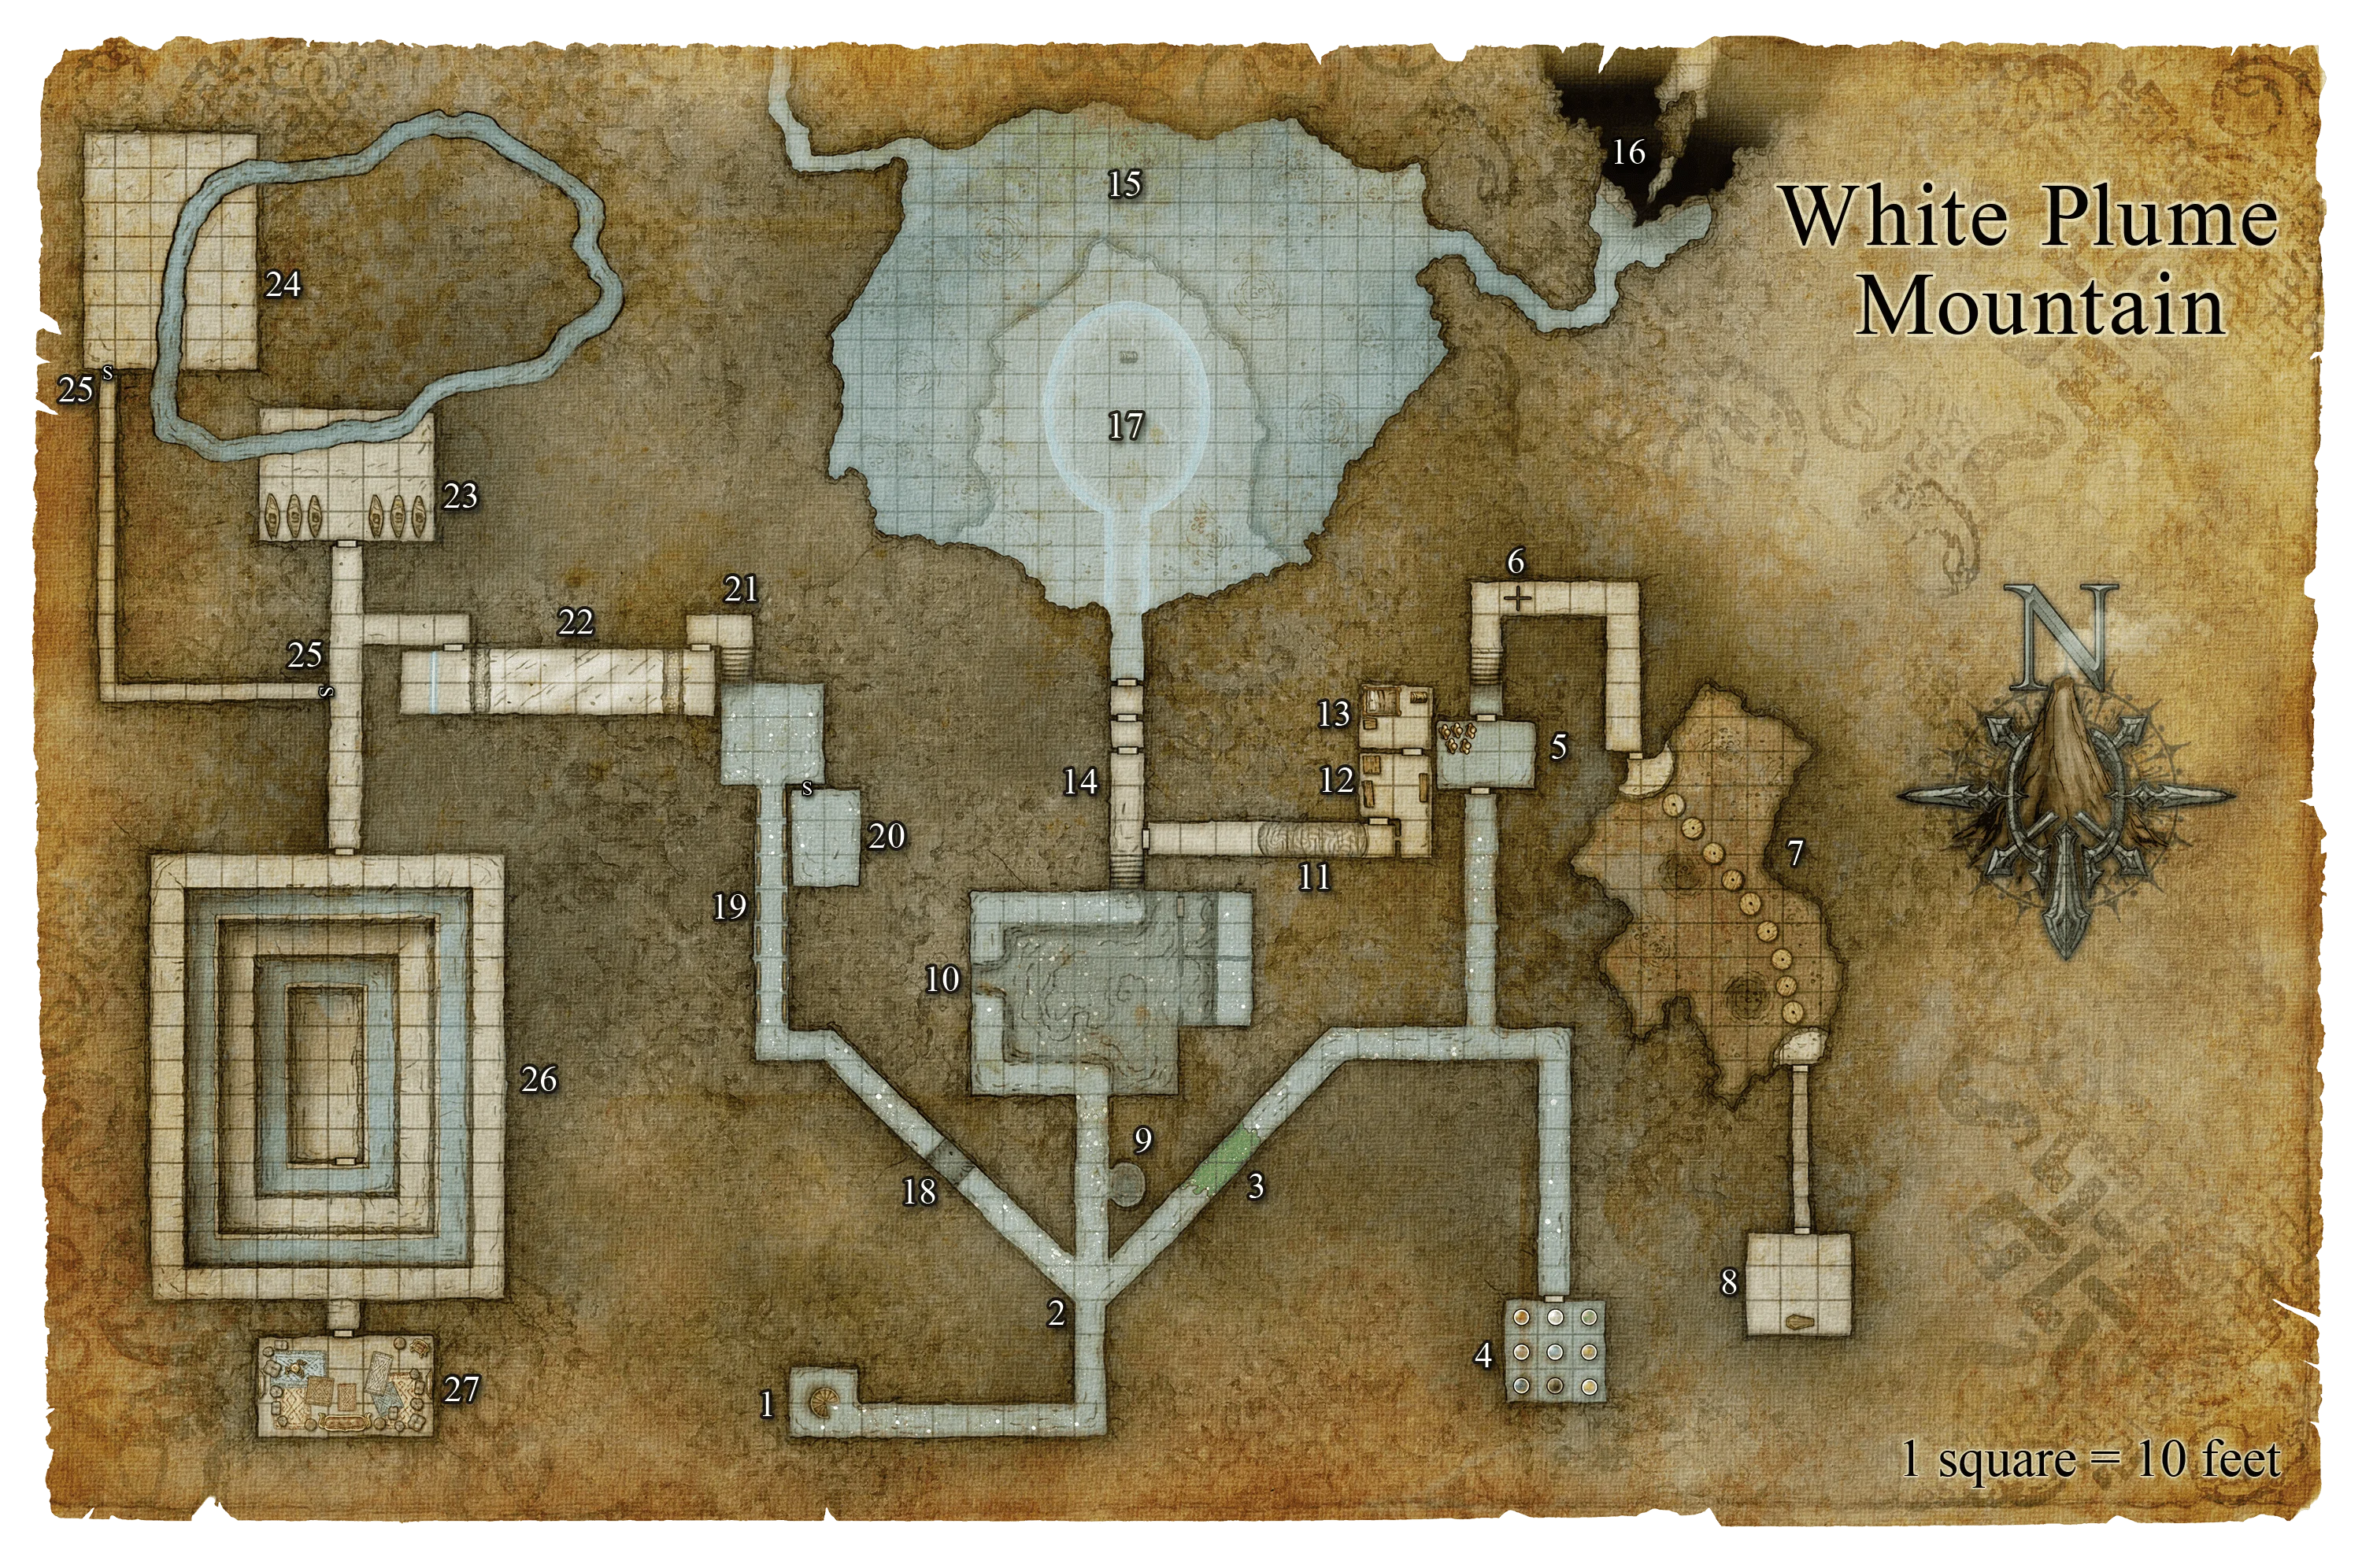
One of the reasons dungeons remain popular is that their directed graphs not only represent the geography of the dungeon, but also the flow of the narrative. The dungeon is a tool to control the pacing and sequence of the story and place payouts such that reaching them requires certain challenges. You can see some explicit examples of this in a thread on this topic at Story Games. This thread has a number of opinions on what traits these graphs need to make dungeons “fun”. I also provide side by side comparisons of the maps of some classic dungeons (Tomb of Horrors, Keep on the Borderlands, White Plume Mountain) with their directed graph representations. For example, here is the graph of White Plume Mountain, which clearly shows its “three silo” design:

As a quick example of how graph analysis can be used, take a look at room 2. The graph makes in painfully obvious that the adventurers will be moving in and out of that room multiple times. So, it would be good to make that room memorable somehow or, perhaps, contain some kind of trap that needs to be dealt with each time through the room. The revised version of White Plume delivers here (see PDF at link above), with a challenge that is similar general each time through, but still different enough in the specifics that it doesn’t get annoying.
One thing I don’t spell out in that thread is exactly how I built
these graphs. The key is a program called dot, which is
part of the GraphViz package. Once
you get that installed, you need to make a .dot file to
represent the dungeon. This is just a text file that follows a specific format.
These can get complicated, but for turning dungeons into graphs, we only
use a really small portion of the format. It starts with a shell
definition that defines the file as a directed graph, and contains a
single graph
attribute for spacing out the nodes:
digraph G {
    ranksep="0.4 equally";
}
Let’s use a smaller
example from one of last year’s One Page Dungeon contest winners: map
three from Antti Hulkkonen’s “Den of Villainy!” (reproduced to the right
through the magic of the Creative Commons license). At each room on a
the map, enter one line for each connection the room has. For example,
room 1 on the map leads to rooms 2 and 9. So, one line is
"1" -> "2" and the other is "1" -> "9".
Do that for each room. Then save the file and open it with graphviz (or
open a command line and run dot on it). That’s the basics
of it. You can also add some embellishments to each line, like using a
different color for secret doors and so on. The result might look like
this:
digraph G {
    ranksep="0.4 equally";

    "8" -> "3" [dir="both"];
    "1" -> "2" [dir="both"];
    "1" -> "9" [dir="both", color="blue", style="dashed"];
    "2" -> "3" [dir="both"];
    "2" -> "4" [dir="both"];
    "3" -> "5" [dir="both"];
    "3" -> "6" [dir="both"];
    "4" -> "5" [dir="both"];
    "5" -> "13" [dir="both", color="blue", style="dashed"];
    "6" -> "7" [dir="both", color="blue", style="dashed"];
    "9" -> "10" [dir="both"];
    "9" -> "12" [dir="both"];
    "10" -> "11" [dir="both"];
    "11" -> "12" [dir="both"];
    "11" -> "13" [dir="both", color="blue", style="dashed"];

    /* Mark the entrance rooms */
    "1" [shape=Mdiamond];
    "8" [shape=Mdiamond];
}
The graphviz package will handle the layout of the nodes automatically. Sometimes it does a better job of this than others (and there are tricks you can use to make the output better), but as these graphs are just to visualize the dungeon, they don’t need to be perfect. In this case, the result looks like this:

The flow of the dungeon becomes more clear in this graph, with the one whole branch only accessible through secret doors, a main interconnected section, and two key secret rooms (which, significantly, are furthest away from the entry ponts). All very rational.